HPA原理与实践
本文讲解Kubernetes HPA(Horizontal Pod Autoscaler)的基础知识
架构概述
要想做自动缩容,肯定要知道什么是HPA(Horizontal Pod Autoscaler),以及HPA的工作原理。
使用Kubernetes进行容器编排的主要优势之一是,它可以快速、简单的水平扩展我们的应用程序并解决增加的负载。
本质上,Horizontal Pod Autoscaler可以根据CPU和Mem使用量来扩展部署,但是在相对复杂的使用场景中,我们需要根据自己的需求来自定义指标实现自动缩容。
架构图:
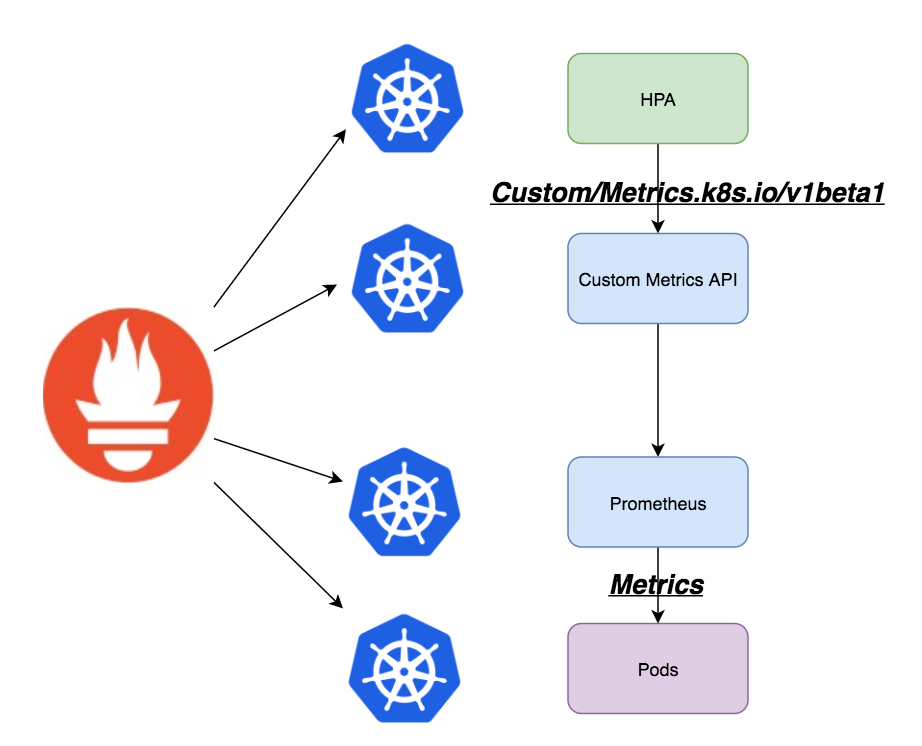
Prometheus现在已经成为监控部署的工作负载和Kubernetes集群的标准工具;Prometheus Adapter 可以利用Prometheus收集指标且使用它们来制定扩展策略。
这些指标由 Custom Metrics API服务公开,可以被 Horizontal Pod Autoscaling 对象使用。
我们将使用 Prometheus Adapter 从 Prometheus 中提取自定义指标,然后让 Horizontal Pod Autoscaler(HPA)使用它来缩放Pod。
部署实践
首先,我们部署一个应用程序,在这个应用程序上Prometheus提取指标定义扩展策略实现自动缩放。
apiVersion: v1
kind: Namespace
metadata:
  name: nginx
---
apiVersion: apps/v1
kind: Deployment
metadata:
  name: nginx-deployment
  namespace: nginx
  labels:
    nginx-app: nginx-server
    component: core
spec:
  replicas: 1
  selector:
    matchLabels:
      nginx-app: nginx-server
  template:
    metadata:
      annotations:
        prometheus.io/path: "/status/format/prometheus"
        prometheus.io/scrape: "true"
        prometheus.io/port: "80"
      labels:
        nginx-app: nginx-server
    spec:
      affinity:
        podAntiAffinity:
          preferredDuringSchedulingIgnoredDuringExecution:
          - weight: 100
            podAffinityTerm:
              labelSelector:
                matchExpressions:
                - key: nginx-app
                  operator: In
                  values:
                  - nginx-server
              topologyKey: kubernetes.io/hostname
      containers:
      - name: nginx-demo
        image: vaibhavthakur/nginx-vts:1.0
        imagePullPolicy: Always
        resources:
          limits:
            cpu: 2500m
          requests:
            cpu: 2000m
        ports:
        - containerPort: 80
          name: http
---
apiVersion: v1
kind: Service
metadata:
  namespace: nginx
  name: nginx-service
spec:
  ports:
  - port: 80
    targetPort: 80
    name: http
  selector:
    nginx-app: nginx-server
  type: LoadBalancer
以上文件会创建一个名为nginx的命名空间,并在其中部署示例Nginx的APP。可以使用该服务访问该应用程序,并通过端口80在路径 /status/format/prometheus 暴露nginx-vts的相关指标。
为了方便测试,我在内网的DNS服务器中设置好域名映射关系,如果没有的话,可以直接使用本地hosts绑定即可,域名为 nginx-vts.awslabs.cn。
创建 Prometheus Adapter ConfigMap 配置文件
apiVersion: v1
kind: ConfigMap
metadata:
  name: adapter-config
  namespace: monitoring
data:
  config.yaml: |
    rules:
    - seriesQuery: 'nginx_vts_server_requests_total'
      resources:
        overrides:
          kubernetes_namespace:
            resource: namespace
          kubernetes_pod_name:
            resource: pod
      name:
        matches: "^(.*)_total"
        as: "${1}_per_second"
      metricsQuery: (sum(rate(<<.Series>>{<<.LabelMatchers>>}[1m])) by (<<.GroupBy>>))